ARB
As of March 30, 2026, Arbitrum (ARB) is trading at approximately 0.412 USD, reflecting a -3.61% decrease from the previous close.
| Current Price | 24h Price Change | 7-Day Avg Price | Support Level | Next Resistance |
| $0.412 USD | -3.61% | $0.435 USD | $0.253 USD | $2.28 USD |
📈 Technical Analysis Summary
- Price Movement: The -3.61% decrease indicates Bearish pressure; potential uncertainty or profit-taking.
- 7-Day Average Comparison: Trading below the 7-day average ($0.435 USD); weak or consolidating trend; watch for support breakdown.
- Support and Resistance Levels: Price is above support ($0.253 USD); confirms bullish base. Room for growth before hitting resistance ($2.28 USD).
- RSI Analysis: RSI at 51.66 indicates Neutral zone; balanced market.
- MACD Analysis: Flat MACD (-0.01); no strong directional bias.
📊 Market Sentiment
| Indicator | Value | Interpretation |
|---|---|---|
| RSI | 51.66% | Neutral; neither overbought nor oversold |
| MACD | -0.01 | Bearish; suggests downward momentum |
| Above 7-Day Avg? | No | Indicates bearish pressure or cooling off |
| Above Support? | Yes | Suggests price stability above support. |
Arbitrum Price Prediction Preview
| Forecast Range | Prediction Trend |
|---|---|
| Daily | 📉 Bearish — Caution in the short term due to weakening indicators |
| Weekly | 🔻 Weak — Risk of short-term pullback if support breaks |
| Monthly | ⚠️ Watch volume — Potential trend exhaustion in ARBUSD |
| Yearly | 🧯 Uncertain — Macro factors may limit long-term upside for ARBUSD |
Related News
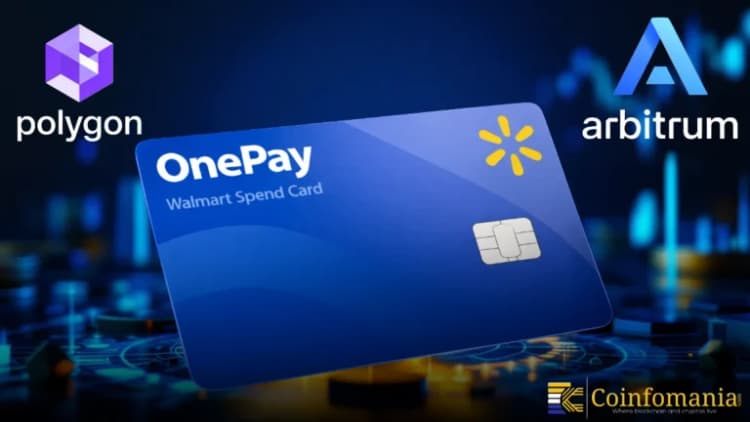
OnePay Expands Crypto Offerings With Arbitrum and Polygon
Walmart-backed fintech platform OnePay is accelerating its crypto expansion by adding Arbitrum (ARB), Polygon (POL), and SUI tokens to its platform. This follows a March 20 update that included Solana and XRP, allowing users to convert fiat into crypto across multiple blockchains such as Ethereum and Optimism. With these additions, OnePay is positioning itself as […]
Hanan Zuhry
Author
Offchain Labs Deepens Its Commitment to Arbitrum’s Expanding Network
Vandit Grover
Author
Arbitrum DEX Volume Hits 6-Month High Amid On-Chain Growth
Vandit Grover
Author
$ARB Adds $3.5B to Stablecoin Market Cap in 6 Months
Vandit Grover
Author
Arbitrum Stablecoin Supply Crosses $5 Billion
Vandit Grover
Author
Arbitrum was built to address the scaling challenges on Ethereum by lowering costs and enabling more transactions happen at the same time. Arbitrum’s Optimistic Rollups handle transactions outside the Ethereum network so as to unburden the network from heavy traffic. Thanks to this strategy, developers can make dApps better, faster and cheaper, encouraging more sectors such as DeFi and gaming to start using Ethereum.
How Does Arbitrum Work?
Arbitrum adopts an Optimistic Rollup solution, which confirms transactions without verification unless there is a conflict over a transaction. The implementation of this technique greatly lowers the load on the Ethereum main network. Because Arbitrum is based on the EVM, dApps made for Ethereum can be moved easily to the Arbitrum network. People online say that the platform supports 40,000 transactions per second, making its block time about 1 second which is better compared to Ethereum's 15 transactions per second and block time of 15 seconds.
Arbitrum vs. Other Cryptos
Feature | Arbitrum | Ethereum | Optimism |
Purpose | Ethereum scaling | Smart contracts | Ethereum scaling |
Consensus | Optimistic Rollup | Proof-of-Stake | Optimistic Rollup |
TPS | ~40,000 | ~15 | ~2,000 |
EVM Compatibility | Full | Native | Full |
Gas Fees | Low | High | Low |
Decentralization | Moderate | High | Moderate |
Launch Year | 2021 | 2015 | 2021 |
Arbitrum distinguishes itself with higher scalability and full EVM compatibility, making it a compelling choice for developers seeking efficient Ethereum scaling solutions.
Technology Behind Arbitrum
At the heart of Arbitrum's technology lies Optimistic Rollups, which gather several transactions off-chain and send just one proof to Ethereum. With this method, fees are cut and transactions happen without delays. Since the platform uses the full EVM, it meshes well with current Ethereum creations and other apps. Because of Arbitrum Orbit and Arbitrum Stylus, Arbitrum can be used by developers to build new scalable blockchains and make use of several programming languages.
Is Arbitrum a Good Investment?
As of May 2025 Arbitrum (ARB) is trading at $0.398 and its total market capitalization is currently around $1.93 billion. Changes in the token’s price have reflected the natural volatility found in all cryptocurrency markets. Even so, experts think Arbitrum’s strong technology and wider use could mean it will grow in the long run. People planning to invest should look into all the information carefully and consider how the market works.
Legal and Regulatory Considerations (2025)
Arbitrum is based on a decentralized Layer 2 structure, but applications on the platform can still be closely checked by regulators, mainly in DeFi and tokenizing assets. It is very important for Arbitrum users and developers to obey the rules set by the local government. Because global laws keep evolving, it’s very important to know what your legal obligations are.
How to Buy Arbitrum
ARB tokens are available on several major cryptocurrency exchanges, including:
- Binance
- Coinbase
- Kraken
- OKX
- MEXC
To purchase ARB:
- Create an account on a supported exchange
- Complete any necessary identity verification
- Deposit funds (fiat or cryptocurrency)
- Buy ARB through the exchange's trading platform
- Transfer ARB to a personal wallet for enhanced security
Arbitrum Wallets and Security
- There are several secure ARB wallets you can try
- You can store your cryptocurrency with a Ledger or Trezor Hardware Wallet
- Among the important software wallets are: MetaMask and Trust Wallet
- The Arbitrum BridgeWallet also serves as a Web Wallet for you
Security Tips:
- Place your most valuable cryptocurrencies in a hardware wallet
- Turn on 2FA whenever possible on every account
- Make sure you have the most recent update of the wallet software installed
- Be careful of online scams and ensure you use the right wallet links
Arbitrum Adoption and Use Cases
The use of Arbitrum is growing in industries across the board. On the Arbitrum network, it’s possible for users to do faster and more affordable trades through Uniswap and GMX. Arbitrum allows blockchain game developers to make their games more enjoyable for players. People minting and selling NFTs choose Arbitrum mainly for the reduced expenses. Arbitrum is sometimes used by businesses for their supply chains and programs that depend on flawless smart contracts.
Arbitrum's Future Outlook & Growth Potential
Various things may help shape the future of Arbitrum.
- More developers building on Arbitrum will make its ecosystem bigger.
- Better cross-chain connectivity might attract more people to use blockchain platforms.
- When rules are made clear, financial institutions are more likely to get involved.
- Improvements in Arbitrum's technology can improve both its performance and security.
Pros and Cons of Investing in Arbitrum
Pros:
- High scalability and low transaction fees.
- Full compatibility with Ethereum's ecosystem.
- Growing adoption across various sectors.
- Active development and community support.
Cons:
- Competition from other Layer 2 solutions.
- Regulatory uncertainties in certain jurisdictions.
- Dependence on Ethereum's overall performance.
Final Thoughts
Arbitrum’s emphasis on Ethereum scaling delivers smoother operation and lower expense, not at the expense of security. Because it is easy for developers and is getting bigger, it is now one of the main players in blockchain. Still, people who are interested in these assets should be aware of how regulations might change and of the risks involved in new technologies.