Pi Coin Daily Price Analysis And Market Trends Report
Let’s break down the latest Pi Network price moves using MACD and RSI signals, key support and resistance levels, and daily chart insights.

Quick Take
Summary is AI generated, newsroom reviewed.
The trading day of June 29 saw mixed market sentiment, with traders reacting to rapid MACD crossovers and RSI signals, triggering both breakouts and breakdowns within a tight trading range.
June 30 turned bearish, as continuous RSI oversold signals and multiple MACD death crosses led to a sharp breakdown, pushing the price toward a support zone at $0.5060.
Despite a 4.1% daily decline, Pi Network maintains a 1.0% weekly gain, suggesting buyers are still present but currently sidelined, awaiting stronger bullish signals.
Over the last 24 hours, the Pi Network price declined by 4.1%, reflecting the bearish pressure on the June 30 session. Despite this dip, the broader weekly picture shows a 1.0% gain, suggesting that buyers are still active, though hesitant. The traders displayed mixed sentiment on June 29, reacting to frequent MACD shifts and sharp RSI signals, creating both breakouts and breakdowns within a tight range. But on June 30, market sentiment turned bearish, as oversold RSI levels persisted and sellers maintained control. Traders appear cautious, awaiting stronger confirmation before making aggressive moves.
Pi Network Traders React to Shifting Momentum Amid Volatility
The trading day of June 29 opened with a surge in bullish momentum. The day kicked off with a long green candle and a noticeable upper wick, suggesting buyers pushed prices aggressively higher. But the upper wick hinted at rejection, signaling that bears stepped in near the daily high of $0.5514. The RSI confirmed this overheated rally with a reading in the overbought zone, indicating buyers were potentially exhausting their strength. As shown in the 5-minute chart-1, by 01:00 UTC, bearish sentiment took hold. A MACD death cross emerged, validating the shift in direction. Sellers reclaimed control, and the price began a gradual decline.
Despite minor support levels forming, conviction remained weak. At 04:30 UTC, a MACD golden cross signaled a shift in short-term momentum, encouraging buyers to re-enter the market. But traders remained hesitant, and the RSI reading of 70.25 at 08:05 UTC suggested overbought conditions again, limiting upward room. Market sentiment turned cautious. Traders appeared uncertain, buying on dips but quickly taking profits. At 12:20 UTC, a green Doji bar signaled indecision. Minutes later, a red candle confirmed bearish control as a MACD death cross appeared. Sellers overwhelmed buyers, causing a steep drop to $0.5125, confirmed by an RSI oversold reading of 22.16.
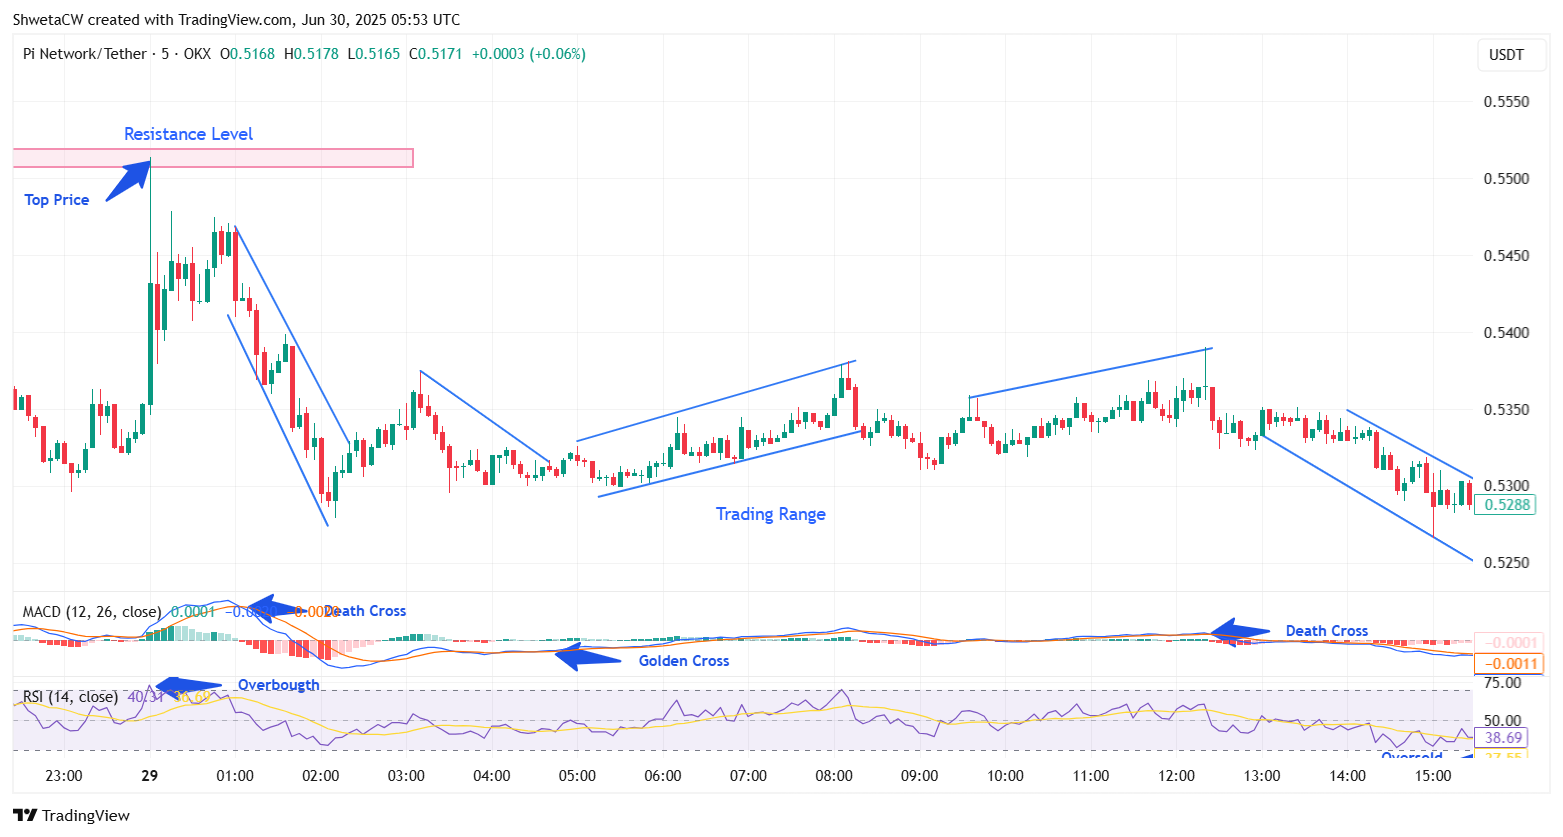
PI/USDT 5-Min Chart-1, analyzed by ShwetaCW, published on TradingView, June 30, 2025
The market showed panic selling, but sharp lower wicks indicated buyers were still watching closely. By late afternoon, signs of recovery emerged. A green pin bar at 16:35 UTC hinted at a buyer defense. This was validated by a MACD golden cross at 16:50 UTC, sparking a new bullish attempt. However, market participants traded cautiously, avoiding full commitment. At 20:45 UTC, a red pin bar showed indecision again, but the price managed to edge upward. A golden cross on the MACD at 21:25 UTC reignited optimism, with prices climbing to a new resistance at $0.5385.
The RSI flashed 78.27, suggesting the rally could be overextended. Traders booked profits, and bears regained some control. At 23:05 UTC, a death cross signaled another reversal as Pi Network entered June 30th.
Pi Network Sees Prolonged Selling Pressure on June 30
On the trading day of June 30, Pi Network opened with modest price fluctuations, but the momentum quickly turned bearish. This move followed the previous day’s MACD death cross at 23:05 UTC, which set the tone for early trading. The price is trending downward steadily, with sellers gaining confidence. From 04:10 to 04:35 UTC, the RSI is signaling an oversold and reinforcing bearish sentiment. Additional RSI oversold readings at 05:35 and 06:05 UTC reflected sustained selling pressure.
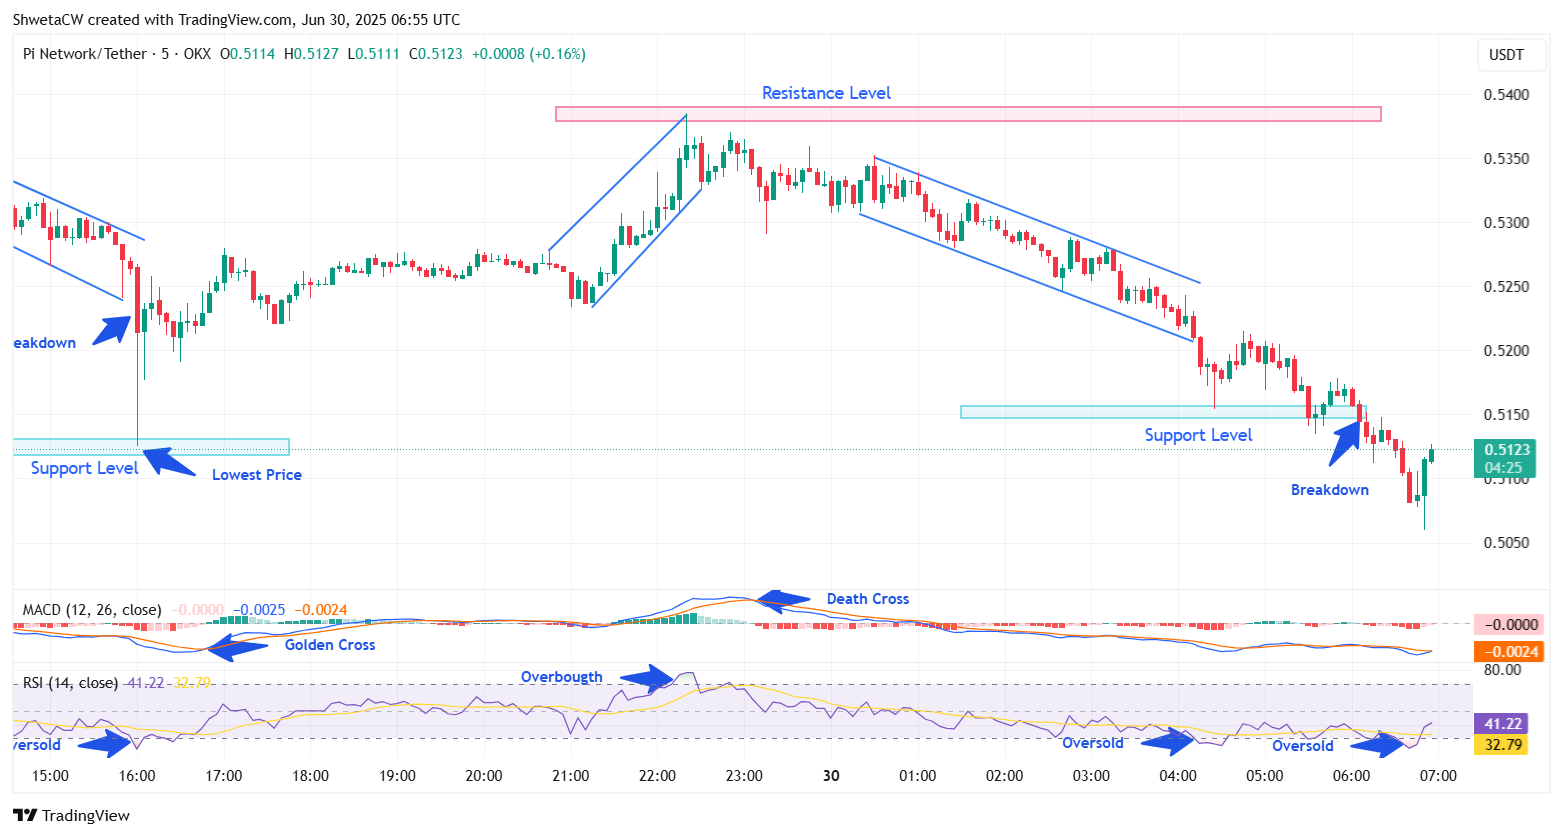
PI/USDT 5-Min Chart-2, analyzed by ShwetaCW, published on TradingView, June 30, 2025
As shown in the 5-minute chart-2, A second death cross on the MACD confirmed that the bears were in control. At 06:30 UTC, a red-bodied candle appeared, visually confirming the breakdown as price action weakened further. This was followed by another RSI oversold at 06:35 UTC, cementing the market’s downward bias. Despite minor fluctuations, Pi struggled to hold support, and the price continues to hover around $0.51, marking a bearish tone for the session.
Pi Network Price Outlook
Based on the current price analysis, if the downward trend persists, Pi Network could break the key support level at $0.50 and go to lower levels. Sellers appear to maintain control, with market sentiment leaning bearish as oversold RSI conditions linger. But if buyers regain momentum, a reversal could push the price above the $0.51 resistance. A sustained breakout here might allow Pi to re-enter its previous trading range and potentially challenge the $0.53 resistance once again. Market sentiment remains cautious. Traders are keeping a close watch on MACD and RSI indicators for confirmation of the next move. Bulls are looking for a breakout, while bears are waiting for signs of weakness. With both buyers and sellers on edge, this price range is a key decision zone and will likely shape Pi Network’s short
Follow us on Google News
Get the latest crypto insights and updates.