XRP Price Analysis and Ripple Daily Updates
Let’s examine XRP price analysis, from downtrend channel to bullish flag, guided by MACD and RSI indicators.

Quick Take
Summary is AI generated, newsroom reviewed.
On June 30, 2025, XRP experienced a bearish trading session, dropping from a high of $2.211 to a low of $2.171 amid intense selling pressure.
Multiple bearish MACD crossovers and RSI oversold signals confirmed downward momentum, breaking key support zones like $2.190 and $2.186.
Despite temporary rebounds triggered by MACD golden crosses, XRP’s uptrends were short-lived, facing resistance near $2.193 before further declines.
June 30, 2025, was a bearish trading day for XRP with ongoing downward pressure throughout the day. XRP price reached an intraday high of $2.211 before falling to a low of $2.171, with the current price being at $2.18. Several oversold signals were evident on the Relative Strength Index (RSI), indicating ongoing selling momentum. The day also saw some breakouts of channel edges and horizontal support points, which further approved the bearish momentum. In addition, several death crosses triggered further downside Ripple price movement.
Valid Breakout Pushes XRP Price Down to $2.190 Support Zone
Early in the trading session, XRP price fluctuated inside an upward channel with temporary bullish momentum. The price drifted into overbought territory on the RSI at 00:25 UTC, suggesting a reversal. Soon after, at 00:48 UTC, a bearish MACD crossover reinforced fading momentum. Only three minutes later, the channel broke out convincingly with a significant full-body red candle, triggering a valid bearish breakout. Subsequent to the breakout, the price collapsed to hit as low as $2.190.
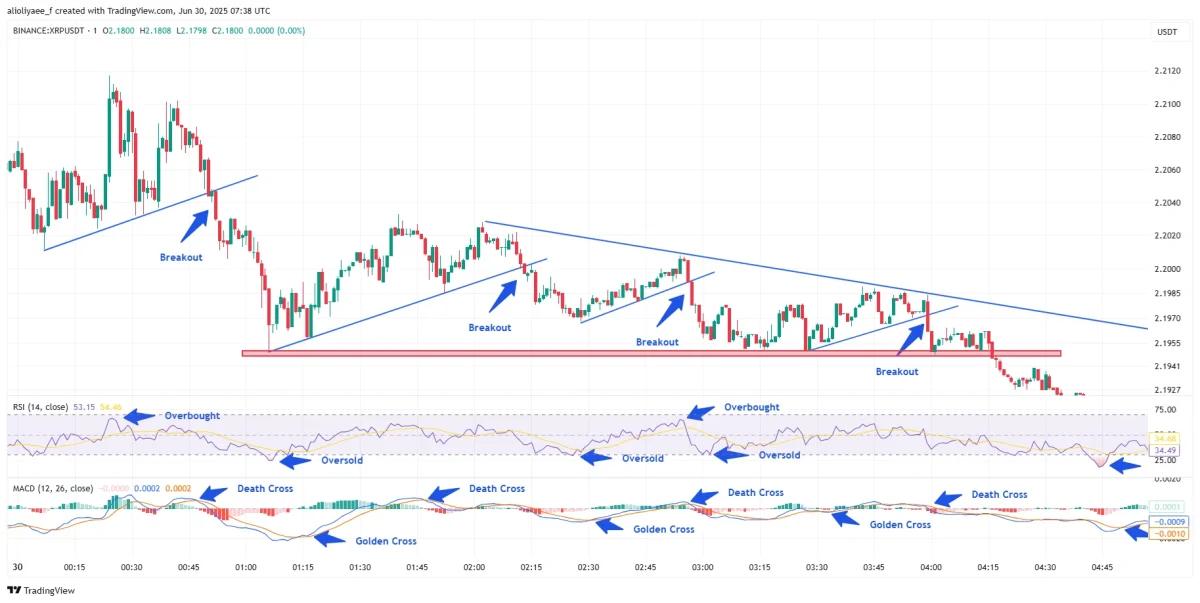
Chart 1: XRP/USDT M1 chart, analyzed by alioliyaee_f, published on TradingView, June 30, 2025.
XRP Slides to $2.186 After Repeated MACD Sell Signals
A bearish crossover appeared on the MACD at 2:10 a.m. UTC, and the lower edge of the ongoing upward channel broke out soon after with a strong full-body red candle. The valid breakout pushed the XRP price down to $2.196. RSI entered oversold at the time, and a golden cross on the MACD indicated a potential short-term reversal. The price responded by forming a slight bounce up to $2.200. Later, XRP moved sideways for some time before the subsequent bearish MACD crossover at 3:59 a.m. UTC. It was followed by a more convincing breakdown with the price breaching the day’s key support level at 4:16 a.m. UTC, confirmed by another MACD crossover. XRP then dropped to the next support level around $2.186.
Golden Cross Drives XRP to $2.193 Before Sharp Drop Begins
At 4:45 a.m. UTC, XRP reached the oversold zone on the RSI, which signaled a reversal in the short term. Within four minutes, by 4:49 a.m. UTC, the MACD displayed a golden cross and a buy signal, further suggesting the upward price movement. Following this signal, XRP price increased in an ascending channel to a high of $2.193. The increase, however, was temporary, as the RSI dropped into overbought territory, signaling fatigue.
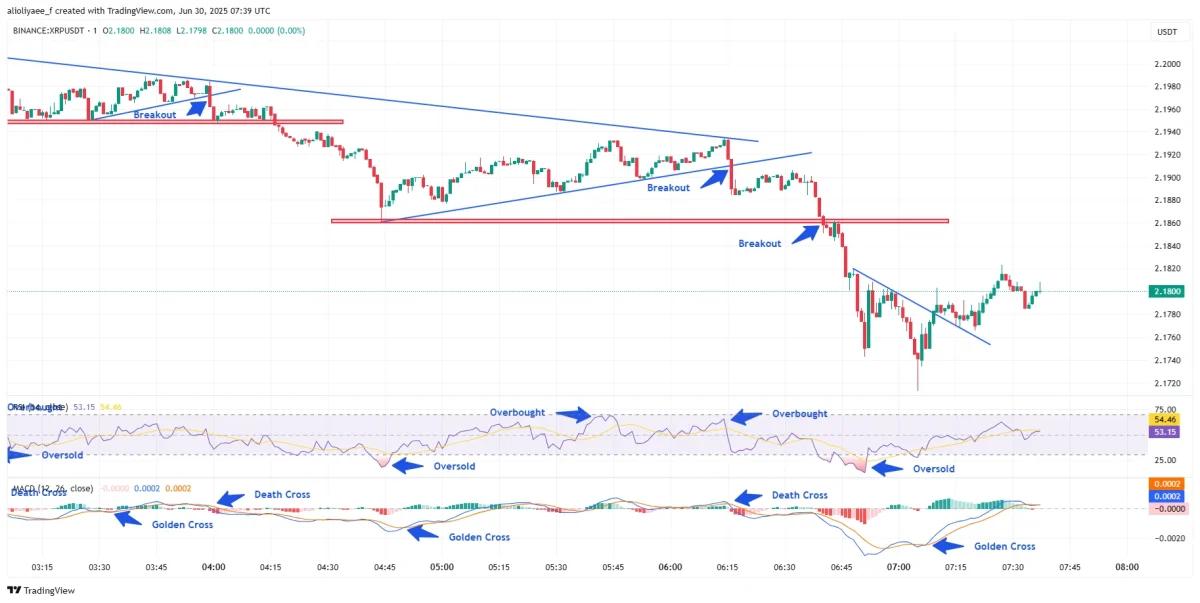
Chart 2: XRP/USDT M1 chart, analyzed by alioliyaee_f, published on TradingView, June 30, 2025.
A bearish crossover on the MACD was not far behind, sparking a reversal in the Ripple price. The upwards channel was broken with a full-body red candle, and a substantial downward spike formed on the chart. XRP price first dropped to $2.188, and shortly after, it broke through the key support level of $2.186. At this point of inflection, another bearish MACD crossover was seen, confirming continued downward pressure.
MACD Golden Cross Lifts XRP Price From $2.171 to $2.186
XRP price continued its downtrend in two sharp moves, first to $2.174 and further down to $2.171, the low of the day. At this price, RSI showed oversold levels, and a golden cross occurred on the MACD, which indicated a probable bounce. In response, XRP broke the declining channel and reversed, moving higher back to test the support level broken earlier at $2.186.
Follow us on Google News
Get the latest crypto insights and updates.